
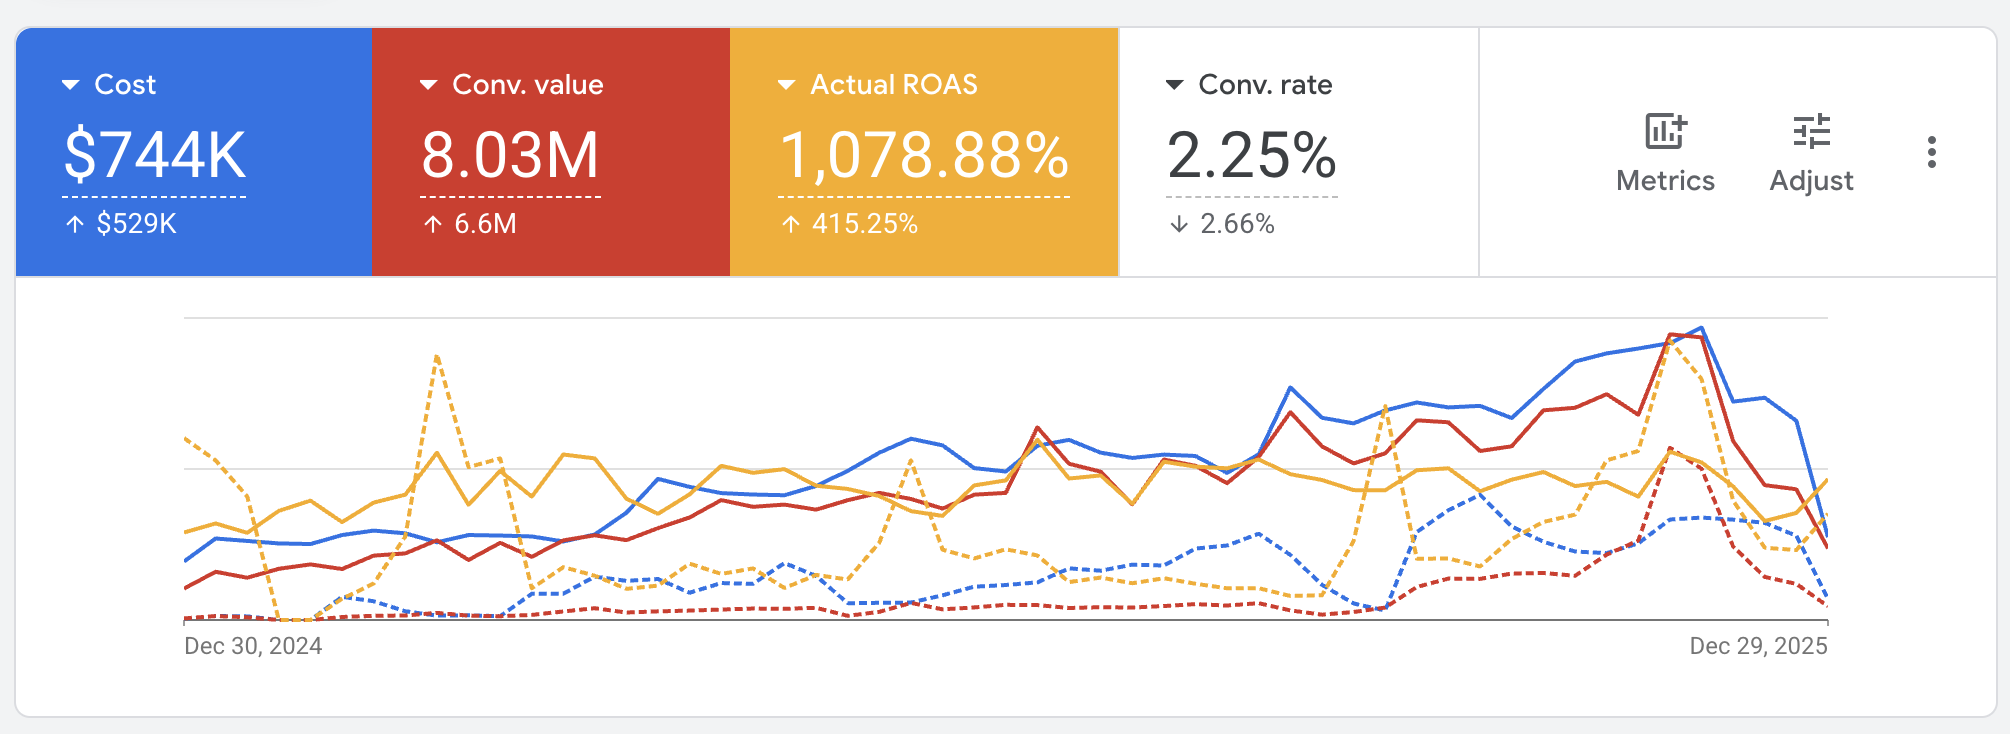
80% Revenue Growth In 6 Months
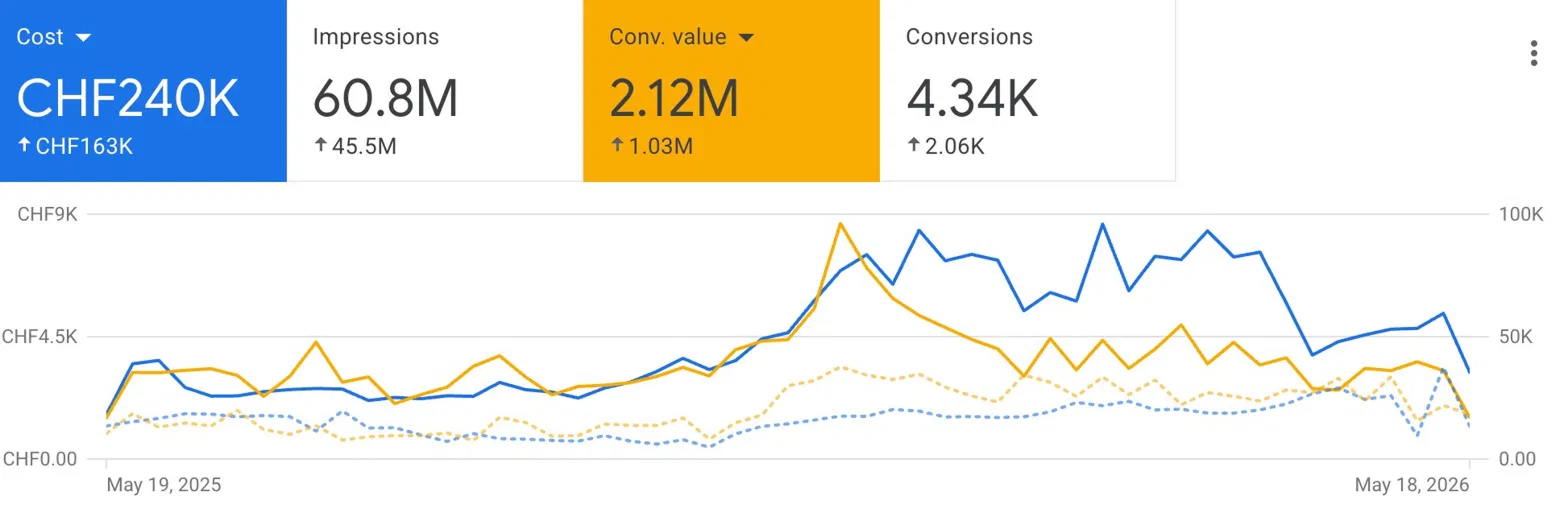
A US live entertainment operator was running a multi-city tour through Meta as if it were one show, generic creative, one broad campaign covering every city, no time-decay logic, and a ticketing-platform attribution gap that was hiding real conversions from the algorithm. Six months after rebuilding the account around city-by-city architecture, a four-phase show-cycle pacing model, and proper ticketing-platform CAPI, ticket revenue grew 80% period-over-period at a 2.30x ROAS.
.png)
- Rebuilt the account city-by-city. Every tour stop got its own campaign, its own geo-fenced targeting, and its own creative variants naming the city and date, the algorithm could finally optimise to local demand, not national average.
- Built a four-phase show-cycle pacing model, Announce / Momentum / Urgency / Last-Call, each with its own creative, bidding logic, and audience layer. Stopped running every show like it was on day one of sale.
- Wired the third-party ticketing platform's purchase data back into Meta via Conversions API. Restored attribution on a meaningful share of sales that had been invisible to the algorithm.
- Built a cross-city social proof loop, sold-out / "selling fast" status from completed shows automatically fed into creative for upcoming ones, turning each tour stop into a proof point for the next.
A Multi-City Tour Being Sold As One Generic Show.
The operator had a tour, a proven act, real demand in the right cities, and an ad account that was treating all of it as one indistinct national push. There was no city-level structure, no awareness of where individual shows sat on their sales curve, and a structural attribution gap that meant Meta was making bidding decisions on a fraction of the actual conversion picture. Some cities were quietly selling out without paid help; others were under-pacing badly with no one noticing in time.
One Generic Campaign Selling 12 Different Shows
Every tour stop was running inside a single campaign with broad-targeted creative that said "see the show" without naming the city or the date. The algorithm had no way to optimise toward local demand, every dollar was effectively betting on the national average, while individual cities had wildly different demand curves, different competing entertainment options, and different price sensitivities.
No Time-Decay Strategy For The Sales Window
Live entertainment shows have a defined arc: announce, momentum, urgency, last-call. Each phase rewards different creative, different bidding logic, and different audiences. The account was running flat through all four phases, the same ads, same budgets, same targeting in week one as in the week of the show. Announce phase was under-pushed; urgency phase was missing the scarcity creative that actually drives last-minute conversion.
Broken Attribution Through Ticketing Platform
Purchases routed through a third-party ticketing platform where standard pixel tracking was patchy at best. A meaningful share of actual ticket purchases never made it back to Meta as conversion events. The algorithm was bidding on incomplete signal, the team was reading underreported ROAS, and budget decisions were being made on a partial picture of what was actually working.
Lineup Going Quiet While Lifestyle Got The Spend
The act was the buying trigger. Fans were converting because of who was performing, not because of venue shots or vibes-y "experience" creative. The account was leaning heavily on lifestyle imagery, beautiful, generic, and missing the single most effective conversion lever in live entertainment: showing the performer doing the thing the fan was paying to see.
Build For The City, Build For The Show Cycle, Fix The Signal.
A touring live entertainment operation isn't one account, it's a dozen mini-campaigns running in parallel, each on its own clock, each with its own local demand curve. We rebuilt the account to reflect that reality, fixed the attribution that was masking what was actually working, and put the performer back at the centre of the creative.
City-By-City Campaign Architecture
Killed the single national campaign. Every tour stop got its own dedicated campaign with:
- Geo-fenced targeting to the venue catchment area and driveable radius (typically 45–60 min)
- City and date named in every piece of creative ("Manchester / Apr 18" treatment baked into hooks, copy, and end frames)
- City-specific budget allocation based on local demand signals and remaining inventory
- Local creative variants referencing landmarks, prior visits, or city-specific cultural beats where appropriate
The algorithm finally had something local to optimise toward, and the team finally had a view of which cities were pacing well and which needed intervention, at the city level, in time to do something about it.
City-By-City ArchitectureFour-Phase Show-Cycle Pacing
Built a structured rhythm that every show ran through:
- Announce (week 1–2): brand-led, lineup-led, "this is happening" creative. Broad reach, awareness-optimised, building the audience pool
- Momentum (week 3–6): social proof, fan reactions, lineup highlights. Conversion-optimised, scaling spend on what's working
- Urgency (final 2–3 weeks): scarcity-led, "selling fast," limited remaining tickets. Heavy retargeting, urgency creative, escalating bids
- Last-Call (final 72 hours): "Tonight / This Weekend" creative, mobile-first, geo-tight, max-bid
Each phase had its own creative briefs, its own bidding logic, and its own audience layer. The account stopped treating week one and week eight identically, and the urgency phase in particular started recovering shows that previously would have left seats empty.
Show-Cycle Pacing ModelTicketing Platform CAPI Integration
Worked with the ticketing platform's API to wire purchase events back into Meta via Conversions API. Order-level data, hashed customer matching, full Advanced Matching parameters. Within a few weeks, the gap between Meta-reported ticket sales and actual ticket sales narrowed substantially. The algorithm started bidding on the real conversion picture, ROAS reporting matched what the finance team was actually seeing in the ticketing dashboard, and budget decisions could be made on signal that reflected reality.
Ticketing Platform CAPICross-City Social Proof Loop
Built a process that turned each completed tour stop into a proof point for upcoming ones. Liverpool sold out → that status was automatically pulled into creative for Manchester, Birmingham, Newcastle. "Selling fast" cities fed into momentum creative for cities still in announce phase. Fan reaction clips from earlier shows became the lineup creative for later shows. The tour stopped launching every city as if it were the first, the social-proof flywheel meant late-tour cities benefited from the demand-signal of every city that had already played.
Cross-City Social Proof LoopSee What We've Done For Other Brands.

Ready to stop guessing?
Apply for a free Paid Ads Audit + Custom Scaling Plan Powered By Our Predictable Scaling Quadrant™ Method. We'll pinpoint exactly where your budget is leaking and show you a clear path to profitable scale.
Joined by 1,500+ businesses